Table of Contents
What Is Total Addressable Market?
Why Total Addressable Market Matters for Businesses
Why Total Addressable Market Matters for Businesses
How to Calculate Total Addressable Market
Total Addressable Market Formula
Total Addressable Market Examples
Common Mistakes When Estimating Total Addressable Market
How TAM Helps Improve B2B Lead Generation Strategy
How to Turn Your TAM Into a Target-Account List
How Cleverly Helps Companies Reach Their Addressable Market
Conclusion
Frequently Asked Questions
Frequently Asked Questions
Modified On :
October 7, 2026
Key Takeaways
- Total addressable market represents the maximum potential demand for a product or service, measured by customer count or annual revenue.
- TAM is the complete market, SAM is the portion your company can serve, and SOM is the portion it can realistically capture.
- The standard revenue formula is: number of potential customers multiplied by average annual revenue per customer.
- Bottom-up TAM calculations are usually more defensible because they use actual account counts, pricing, and customer data.
- Top-down, bottom-up, and value-theory calculations should be compared before major investment decisions.
- A B2B TAM becomes actionable when it is translated into qualified account segments, buying roles, and an outreach plan.
How much revenue could your business generate if every potential customer who fits your market bought from you? Total addressable market, or TAM, answers that question.
TAM represents the full potential demand for a product or service. It can be expressed as the number of possible customers or the total annual revenue those customers could generate.
A defensible TAM does more than make an investor presentation look impressive. It helps B2B teams evaluate markets, prioritize customer segments, estimate revenue potential, and decide where sales and marketing resources should go.
This guide explains what total addressable market means, how to calculate it using three different methods, how TAM differs from SAM and SOM, and how to turn market-size research into a usable target-account list.
What Is Total Addressable Market?
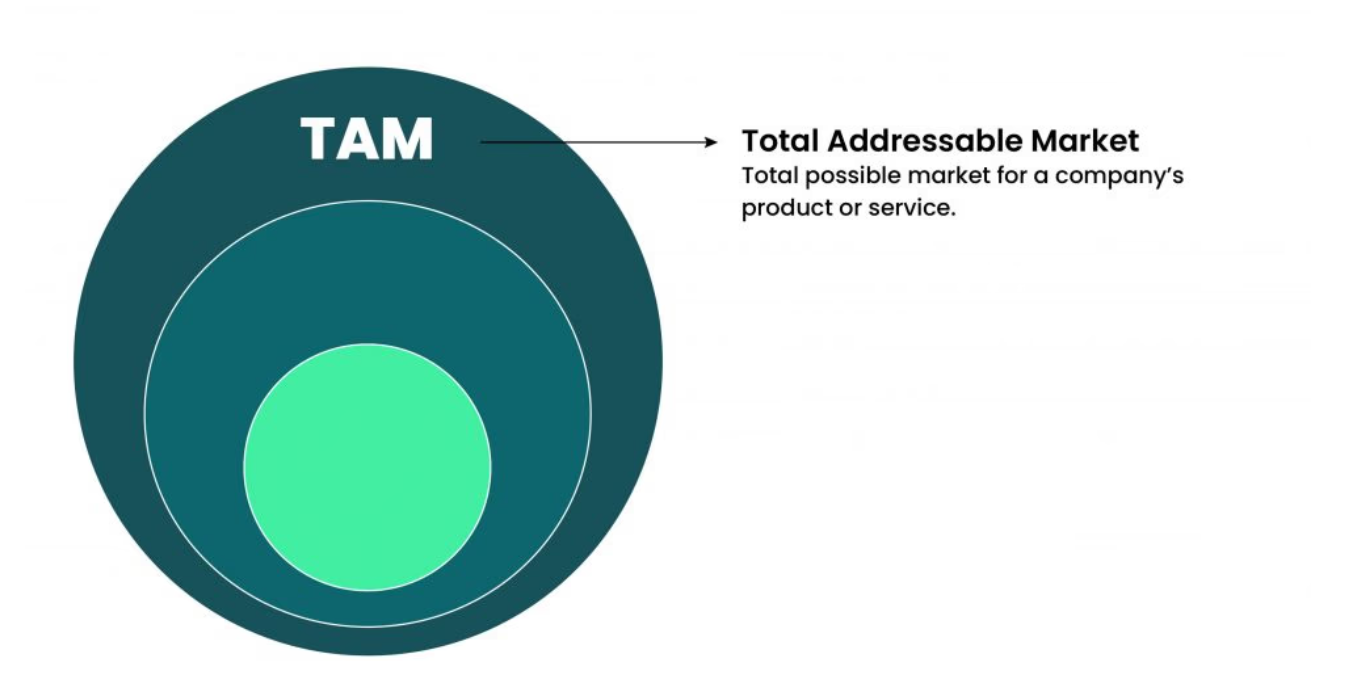
Total addressable market, or TAM, is the maximum potential demand for a product or service if every customer who could reasonably buy it did so.
TAM can be expressed in two ways:
- Customer-based TAM: The total number of people, companies, or accounts that could purchase the product.
- Revenue-based TAM: The total annual revenue those customers could generate.
For example, if 50,000 companies could buy a software product priced at $2,000 per year, the customer-based TAM is 50,000 accounts and the revenue-based TAM is $100 million annually.
TAM describes the market’s full potential before accounting for practical constraints such as geography, sales capacity, product limitations, competitors, and available budget. It is a strategic ceiling, not a sales forecast.
Companies use TAM to evaluate new products, compare market segments, support investment decisions, plan expansion, and determine whether a market is large enough to justify the cost of entering it.
Learn More: 5 Ps of Marketing Explained (With B2B Examples)
🎯 TAM Shows the Market. We Find the Buyers.
Cleverly turns TAM insights into a pipeline using LinkedIn outreach, pay-per-meeting cold email, and guaranteed cold calling.
TAM vs. SAM vs. SOM: What Is the Difference?
TAM, SAM, and SOM describe three different levels of market opportunity.
Total Addressable Market
TAM is the complete demand for a product or service if the business could serve every possible customer. It represents the largest theoretical opportunity.
Serviceable Addressable Market
SAM is the portion of the TAM that the company can serve with its current product, business model, geographic coverage, and customer requirements.
A software company may have a global TAM of 100,000 businesses but only support English-speaking customers in North America. Those practical constraints reduce its serviceable market.
Serviceable Obtainable Market
SOM is the portion of the SAM that the company can realistically capture within a defined period. It accounts for competitors, sales capacity, budget, brand recognition, distribution, and expected market share.
For example:
- TAM: 100,000 companies worth $500 million annually
- SAM: 30,000 companies worth $150 million that the business can currently serve
- SOM: 1,500 companies worth $7.5 million that it could realistically capture
TAM shows the ceiling. SAM defines the reachable market. SOM sets a realistic commercial target.
Why Total Addressable Market Matters for Businesses
TAM total addressable market analysis isn't just a number you put in a pitch deck. It does real work for your business.
Here's why it matters:
- Validates business opportunities before you invest time and money.
- Estimates long-term revenue potential so you can set realistic growth targets.
- Helps prioritize target customer segments instead of going after everyone.
- Supports investment decisions by showing investors the upside.
- Guides go-to-market strategy by clarifying where to focus first.
When you know the scale of your market, you stop guessing and start making decisions backed by data. That's a real competitive edge, especially in B2B.
🚀 From Market Size to Real Sales Meetings
10,000+ companies use Cleverly to convert targeted outreach across LinkedIn, email, and phone into sales-ready conversations.
How to Calculate Total Addressable Market
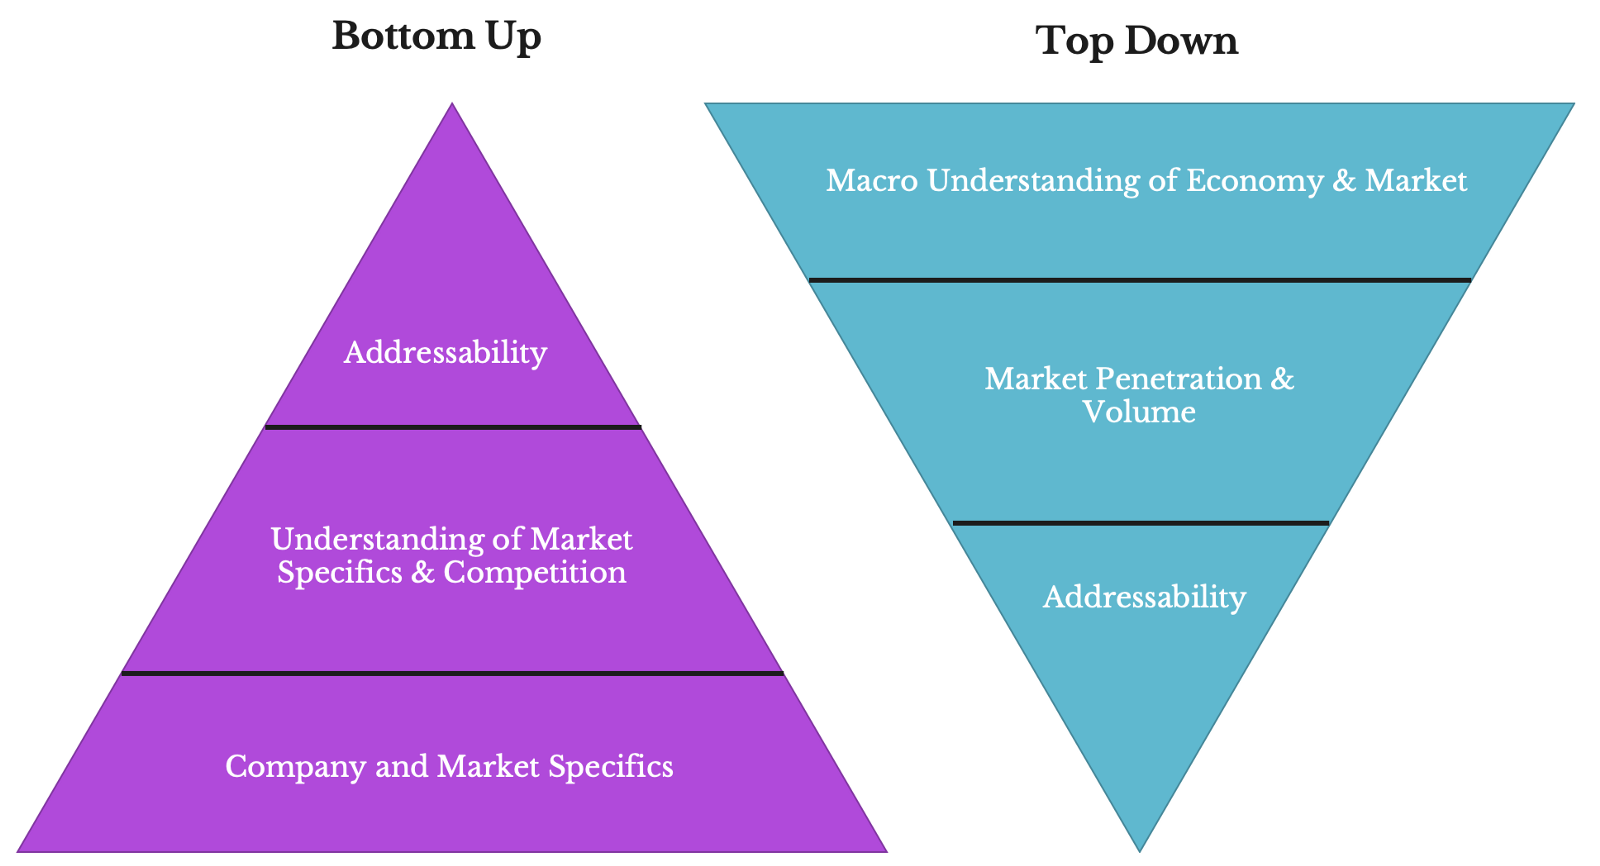
There are three main approaches companies use when thinking about how to calculate total addressable market. Each has its place depending on the data you have available.
Top-Down Market Sizing
This approach starts with big industry research reports and works down to your slice of the market.
For example, if the global CRM software market is worth $80B and you estimate you could realistically target 2% of it, your TAM would be $1.6B.
It's quick, but it can lead to inflated numbers if you're not careful with your assumptions.
Bottom-Up Market Sizing
This is the most reliable method. Instead of starting from the top, you build your TAM from the ground up using real customer data.
You look at:
- How many potential customers exist in your target segment
- What you charge them on average
- Then multiply
It's grounded in actual pricing and realistic customer counts, which makes it much more credible to investors and internal stakeholders.
Value Theory Approach
This one estimates TAM based on the value your product delivers to customers rather than just the number of potential buyers.
If your solution saves a company $10,000 per year and there are 100,000 companies that could use it, your TAM could be as large as $1B, assuming customers would pay based on the value they receive.
This works well for new categories where there's no direct market data yet.
How to Calculate Potential Market Size
Potential market size can be measured by customer count, annual revenue, transaction volume, or another unit that fits the business model.
Use this process:
- Define the product, customer problem, geography, industry, company size, and buying requirements.
- Estimate how many people or companies satisfy those conditions.
- Remove accounts that cannot use, access, or afford the offer.
- Select a realistic annual revenue or transaction value for each customer segment.
- Multiply the qualified customer count by the relevant revenue assumption.
- Compare the result with a top-down industry estimate to identify unrealistic inputs.
For a B2B software company, this may involve combining company databases, government records, industry associations, CRM data, customer interviews, and pricing information.
For example, suppose research identifies 12,000 companies that match the product’s firmographic requirements. If the expected annual contract value is $8,000, the potential revenue-based market size is:
12,000 × $8,000 = $96 million annually
Keep TAM separate from expected sales. The calculation assumes full market capture, while a revenue forecast should reflect realistic conversion rates, competition, sales capacity, and time.
Dive Deeper: Target Account Selling - Methodology, Plan & Template for B2B Growth
Total Addressable Market Formula
The most common revenue-based TAM formula is:
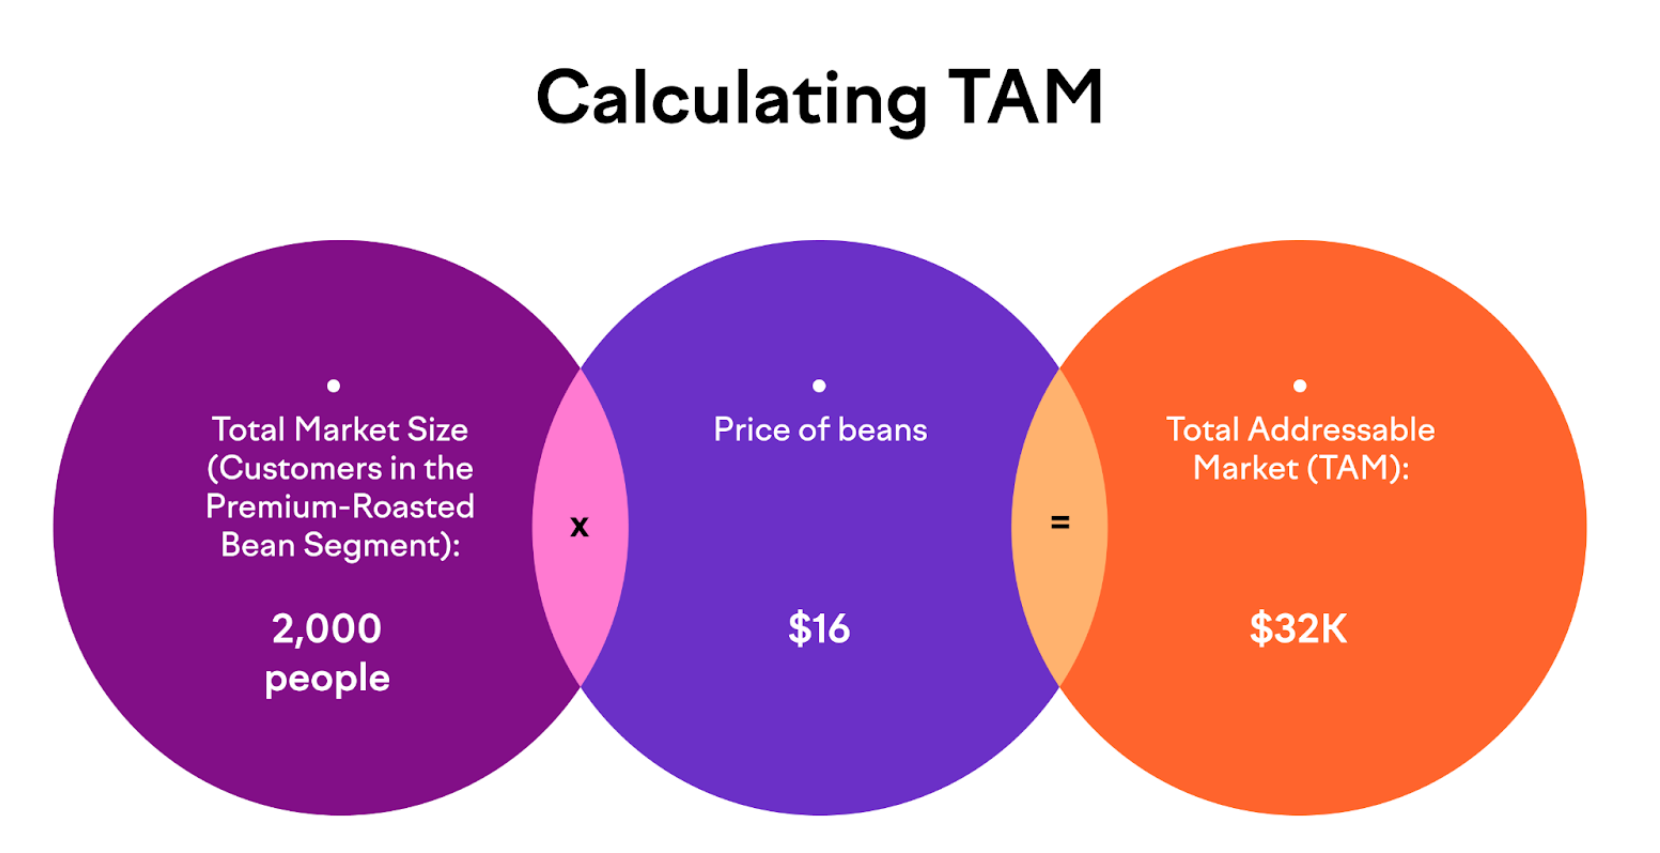
TAM = Number of Potential Customers × Average Annual Revenue per Customer
If 50,000 companies could buy a product priced at $2,000 per year:
50,000 × $2,000 = $100 million in annual TAM
For businesses with several customer segments or pricing tiers, calculate each segment separately:
TAM = Segment A Revenue + Segment B Revenue + Segment C Revenue
Suppose a software company serves:
- 40,000 small businesses at $1,000 annually
- 8,000 mid-market businesses at $5,000 annually
- 1,000 enterprise businesses at $25,000 annually
The calculation would be:
- Small business TAM: $40 million
- Mid-market TAM: $40 million
- Enterprise TAM: $25 million
- Total TAM: $105 million annually
For transaction-based businesses, use:
TAM = Potential Customers × Annual Purchases per Customer × Average Transaction Value
The formula is simple. The difficult part is determining which customers genuinely fit the market and selecting a realistic revenue assumption. Document the source and reasoning behind each input so the final estimate can be reviewed and defended.
Total Addressable Market Examples
Let's look at two quick total addressable market examples to show how this plays out in practice.
Example 1: SaaS CRM Platform
A CRM provider targets U.S. professional-services companies with 20 to 200 employees. Its market research identifies 18,000 businesses that meet those criteria.
The product’s average annual contract value is $6,000.
18,000 potential accounts × $6,000 annual contract value = $108 million TAM
The customer-based TAM is 18,000 accounts, while the revenue-based TAM is $108 million annually. The company would still need to calculate its SAM and SOM before using this figure as a sales target.
Example 2: B2B Marketing Software
A marketing platform serves North American SaaS companies with established sales teams. Research identifies three customer segments:
- 15,000 small companies at $2,400 annually
- 4,000 mid-market companies at $10,000 annually
- 500 enterprise companies at $40,000 annually
The segment calculations are:
- Small business TAM: $36 million
- Mid-market TAM: $40 million
- Enterprise TAM: $20 million
The total revenue-based TAM is $96 million annually, representing 19,500 potential accounts.
Same TAM, very different markets. This is why knowing your segment matters as much as knowing your number.
Common Mistakes When Estimating Total Addressable Market
A lot of companies get TAM wrong, and it can hurt your strategy or your credibility with investors. Watch out for these:
❌ Overestimating market size by using top-down figures without reality-checking them.
❌ Relying only on top-down estimates without validating with real customer data.
❌ Ignoring realistic pricing assumptions and inflating revenue projections.
❌ Confusing TAM with reachable revenue — TAM is the ceiling, not what you'll actually close.
❌ Failing to segment target customers, which leads to unfocused outreach and wasted budget.
The goal is a TAM that's defensible, not just impressive.
How TAM Helps Improve B2B Lead Generation Strategy
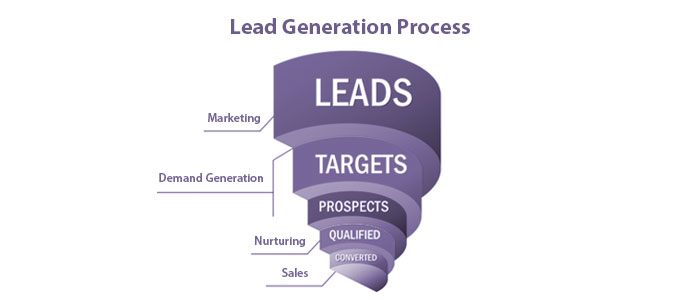
Understanding your total addressable market directly sharpens your lead generation efforts. When you know exactly who your market is, you stop wasting outreach on the wrong people.
How TAM improves your targeting:
- Identifies your ideal customer segments so you're not going broad.
- Focuses outreach on high-value markets where deal sizes justify the effort.
- Prioritizes accounts with stronger revenue potential over low-fit leads.
- Aligns your marketing and sales teams around the same target profile.
Instead of blasting everyone in your industry, you can build a focused list of companies that actually fit your ICP and run outreach that converts. That's where the real pipeline comes from.
A focused B2B lead generation strategy turns market-size research into channel decisions, prospect lists, messaging, and qualified sales conversations.
How to Turn Your TAM Into a Target-Account List
A revenue estimate does not tell a sales team whom to contact. To make TAM useful for B2B lead generation, translate the market definition into account and buyer criteria.
Start by converting the assumptions used in the TAM calculation into company filters:
- Industry and subindustry
- Company size
- Annual revenue
- Geography
- Technology used
- Business model
- Growth stage
- Regulatory requirements
- Operational pain points
- Relevant buying events
Next, identify the people involved in evaluating or approving the purchase. Include decision-makers, operational users, technical evaluators, financial approvers, and internal champions.
Segment the account list by fit and potential value. High-fit accounts with larger revenue potential should receive more research and personalized outreach, while broader segments can use a lighter-touch campaign.
The final account count should reconcile with the customer-based TAM. If the TAM calculation claims that 30,000 companies fit the market but the targeting criteria produce only 4,000 viable accounts, review the original assumptions before setting sales targets.
Translate the market definition into an ideal customer profile that documents the company traits, buyer roles, pain points, and purchase conditions associated with a strong-fit account.
How Cleverly Helps Companies Reach Their Addressable Market

Knowing your TAM is one thing. Reaching it is another. That's where we come in.
As the highest-rated B2B lead generation agency, we help companies turn their TAM insights into actual pipelines through fully done-for-you outbound.
Here's what that looks like in practice:
- Identifying high-fit accounts within your target market using verified data.
- Building prospect lists that match your ICP down to industry, company size, and job title.
- Executing multi-touch outbound campaigns across LinkedIn, cold email, and cold calling.
- Focusing every touchpoint on getting you qualified conversations, not just clicks.
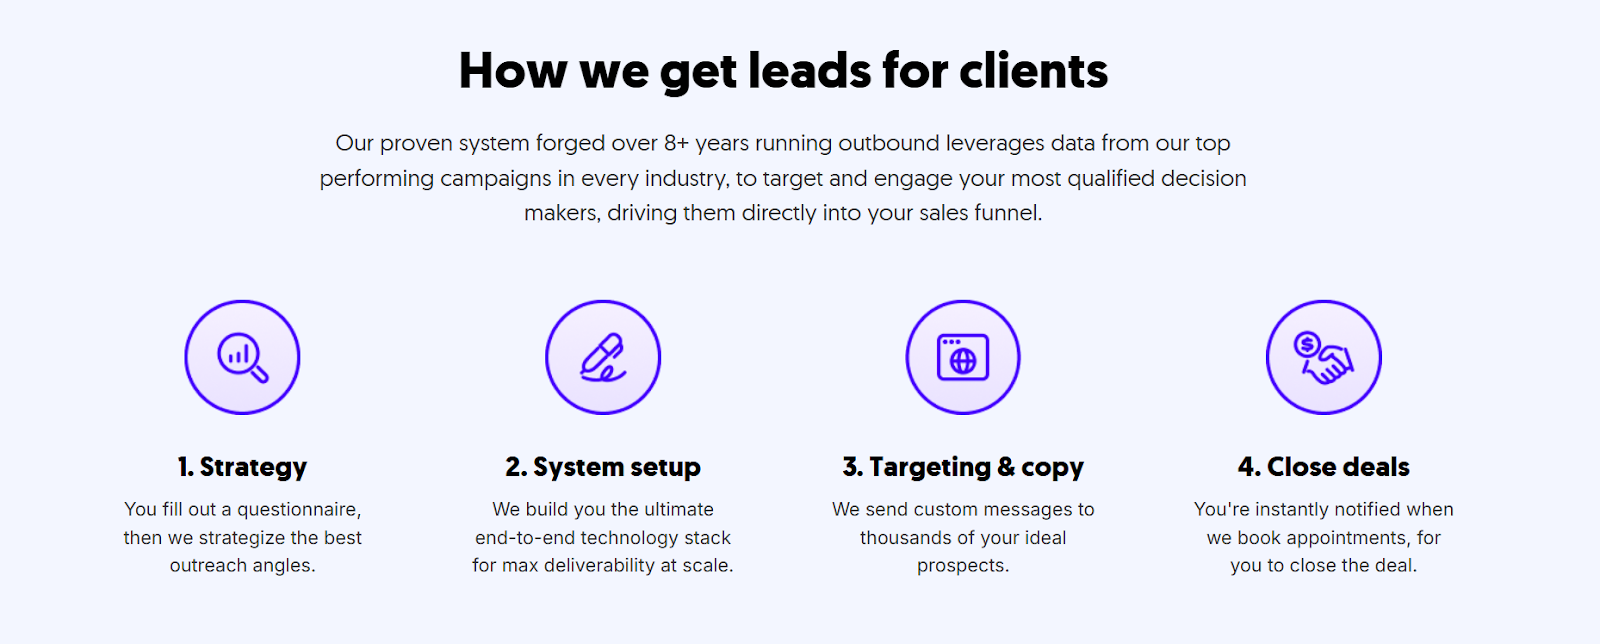
We've helped 10,000+ clients, including teams at Amazon, Google, Uber, PayPal, Slack, and Spotify, generate over $312M in pipeline and $51.2M in closed revenue through LinkedIn outreach alone.
👉 Our LinkedIn lead gen services start at just $397/month.
👉 With our cold email service, you only pay for meeting-ready leads we send you.
👉 And our $5M cold calling system is guaranteed to book you 10 to 30 qualified sales calls every month, or we replace the SDR.

Your TAM is out there. Let us help you reach it.
🚀 Book a free consultation with Cleverly
Conclusion
Total addressable market is one of the most useful tools you have for understanding the scale of your opportunity. It shapes how you plan, pitch, and prioritize.
To recap:
- TAM shows the full revenue potential available in your market.
- Calculating it improves strategic planning and investment decisions.
- Realistic TAM estimates lead to better go-to-market strategies.
- Combining TAM insights with targeted outreach is what actually drives growth.
Know your market. Then go after it the right way.
Frequently Asked Questions
Free Resource
How to Scale a Profitable Cold Call System
Get the complete guide — download it instantly now.

Free Ebook
Download the Free Guide
Enter your details to get instant access.
You're all set! 🎉
Your ebook is downloading now.
Click below if the download didn't start automatically.